Insights Center: One Place to Find and Act on Databricks Insights

Introduction
A US-based pharmaceutical services company had moved its reporting environment to Databricks and adopted its medallion architecture to organize data. While Databricks AI/BI dashboards provided access to valuable business insights, users found it difficult to discover the right dashboards and navigate between them.
HeadToNet addressed this challenge by building Insights Center, a centralized web application that brings Databricks AI/BI dashboards, Genie, and custom React dashboards together in one place. The application also enables users to trigger workflows directly from insights, helping connect analytics with business action.
Additionally, HeadToNet integrated AI agents built with Microsoft Foundry to support user acceptance testing (UAT) and development during the migration from legacy SSRS reports.
The Problem
Despite having its reporting environment on Databricks, the client faced challenges in making analytics easily accessible to its teams.
The key challenges included:
- Dashboard Discoverability: Users struggled to find the right AI/BI dashboards and navigate between them, limiting how easily teams could access the information they needed.
- Visualization limitations: Certain data presentations and interactions required capabilities beyond those supported by standard AI/BI dashboards.
- Legacy report migration: Moving from SSRS reports to modern dashboards required development and UAT effort to ensure the new experience met existing reporting needs.
The client needed a more unified way to access insights, explore data, and take action.
The Solution
HeadToNet developed Insights Center, a centralized React-based web application that acts as a single entry point for the client's Databricks analytics environment.
The application brings together three core capabilities:
- Embedded Databricks AI/BI dashboards: Existing dashboards are accessible directly within Insights Center, making them easier to discover and use.
- Databricks Genie integration: Users can access Genie within the same application to interact with their data.
- Custom React dashboards: Purpose-built dashboards support visualizations and data presentations that standard AI/BI dashboards do not accommodate.
Beyond dashboard access, HeadToNet introduced actionable interactions within the custom dashboards. Users can trigger workflows through buttons directly after reviewing an insight, connecting information with the next business action.
To support the transition from SSRS reports, HeadToNet also integrated AI agents built using Microsoft Foundry. These agents assist with UAT and development activities during the migration process.
Key Capabilities
Unified Dashboard Navigation
A centralized interface helps users discover and access dashboards without having to search across Databricks.
Embedded AI/BI Dashboards
Existing Databricks dashboards are integrated into the application, preserving access to the client's established analytics.
Genie Integration
Databricks Genie is accessible within Insights Center, bringing conversational data exploration into the unified experience.
Custom React Dashboards
Custom-built dashboards enable data visualization and presentation formats beyond the capabilities of standard AI/BI dashboards.
Actionable Insights and Workflow Triggers
Users can initiate workflows directly from custom dashboards, reducing the gap between reviewing an insight and acting on it.
AI-Assisted Report Migration
Microsoft Foundry agents support UAT and development activities as legacy SSRS reports transition to modern dashboards.
Technical Architecture
The solution builds on the client's existing Databricks medallion architecture.
Insights Center sits above the data and analytics layer as a React-based application, bringing together embedded AI/BI dashboards, Genie, and custom React dashboards. Workflow triggers extend the experience beyond visualization, while Microsoft Foundry agents support the UAT and development process for migrated reports.
Architecture Flow:
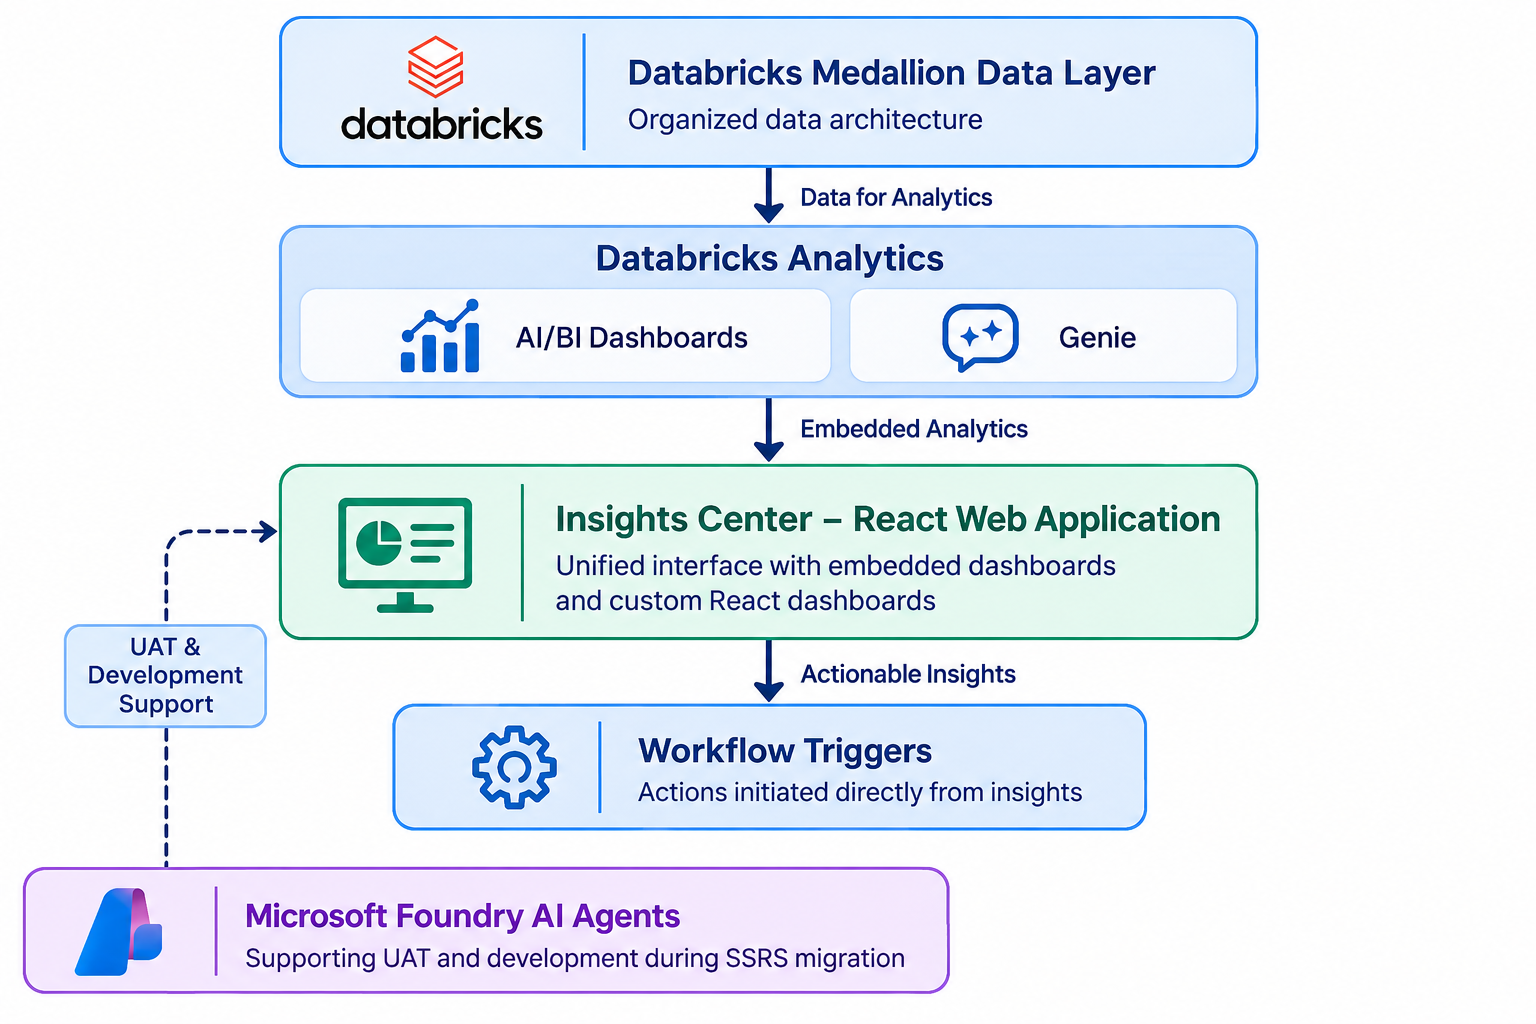
Databricks Medallion Data Layer → AI/BI Dashboards and Genie → Insights Center (React Web Application) → Workflow Triggers
Microsoft Foundry agents are integrated to support UAT and development during the SSRS migration.
Technology Stack and Integrations
- Data Platform: Databricks, Medallion Architecture
- Analytics: Databricks AI/BI Dashboards
- Data Interaction: Databricks Genie
- Frontend: React
- AI and Agents: Microsoft Foundry
- Legacy Reporting: SQL Server Reporting Services (SSRS)
Business Impact
Insights Center created a more accessible and action-oriented analytics experience for the client.
Key business value includes:
- Simplified analytics access: Centralized dashboard discovery and navigation through one application.
- A more connected analytics experience: Embedded dashboards, Genie, and custom visualizations are available within a unified interface.
- Insights connected to action: Workflow triggers allow users to initiate follow-up actions directly from custom dashboards.
- Greater visualization flexibility: Custom React dashboards accommodate data presentations beyond standard AI/BI dashboard capabilities.
- Migration support: Microsoft Foundry agents assist UAT and development as legacy SSRS reports move to modern dashboards.
Conclusion
Insights Center demonstrates how a unified application can extend the value of a Databricks analytics environment.
By combining native Databricks capabilities with custom React dashboards, workflow triggers, and Microsoft Foundry agents, HeadToNet helped bring dashboard discovery, data exploration, and business action into one experience.
The result is an analytics interface designed not just to present insights, but to help users act on them.
StackAudit Offer